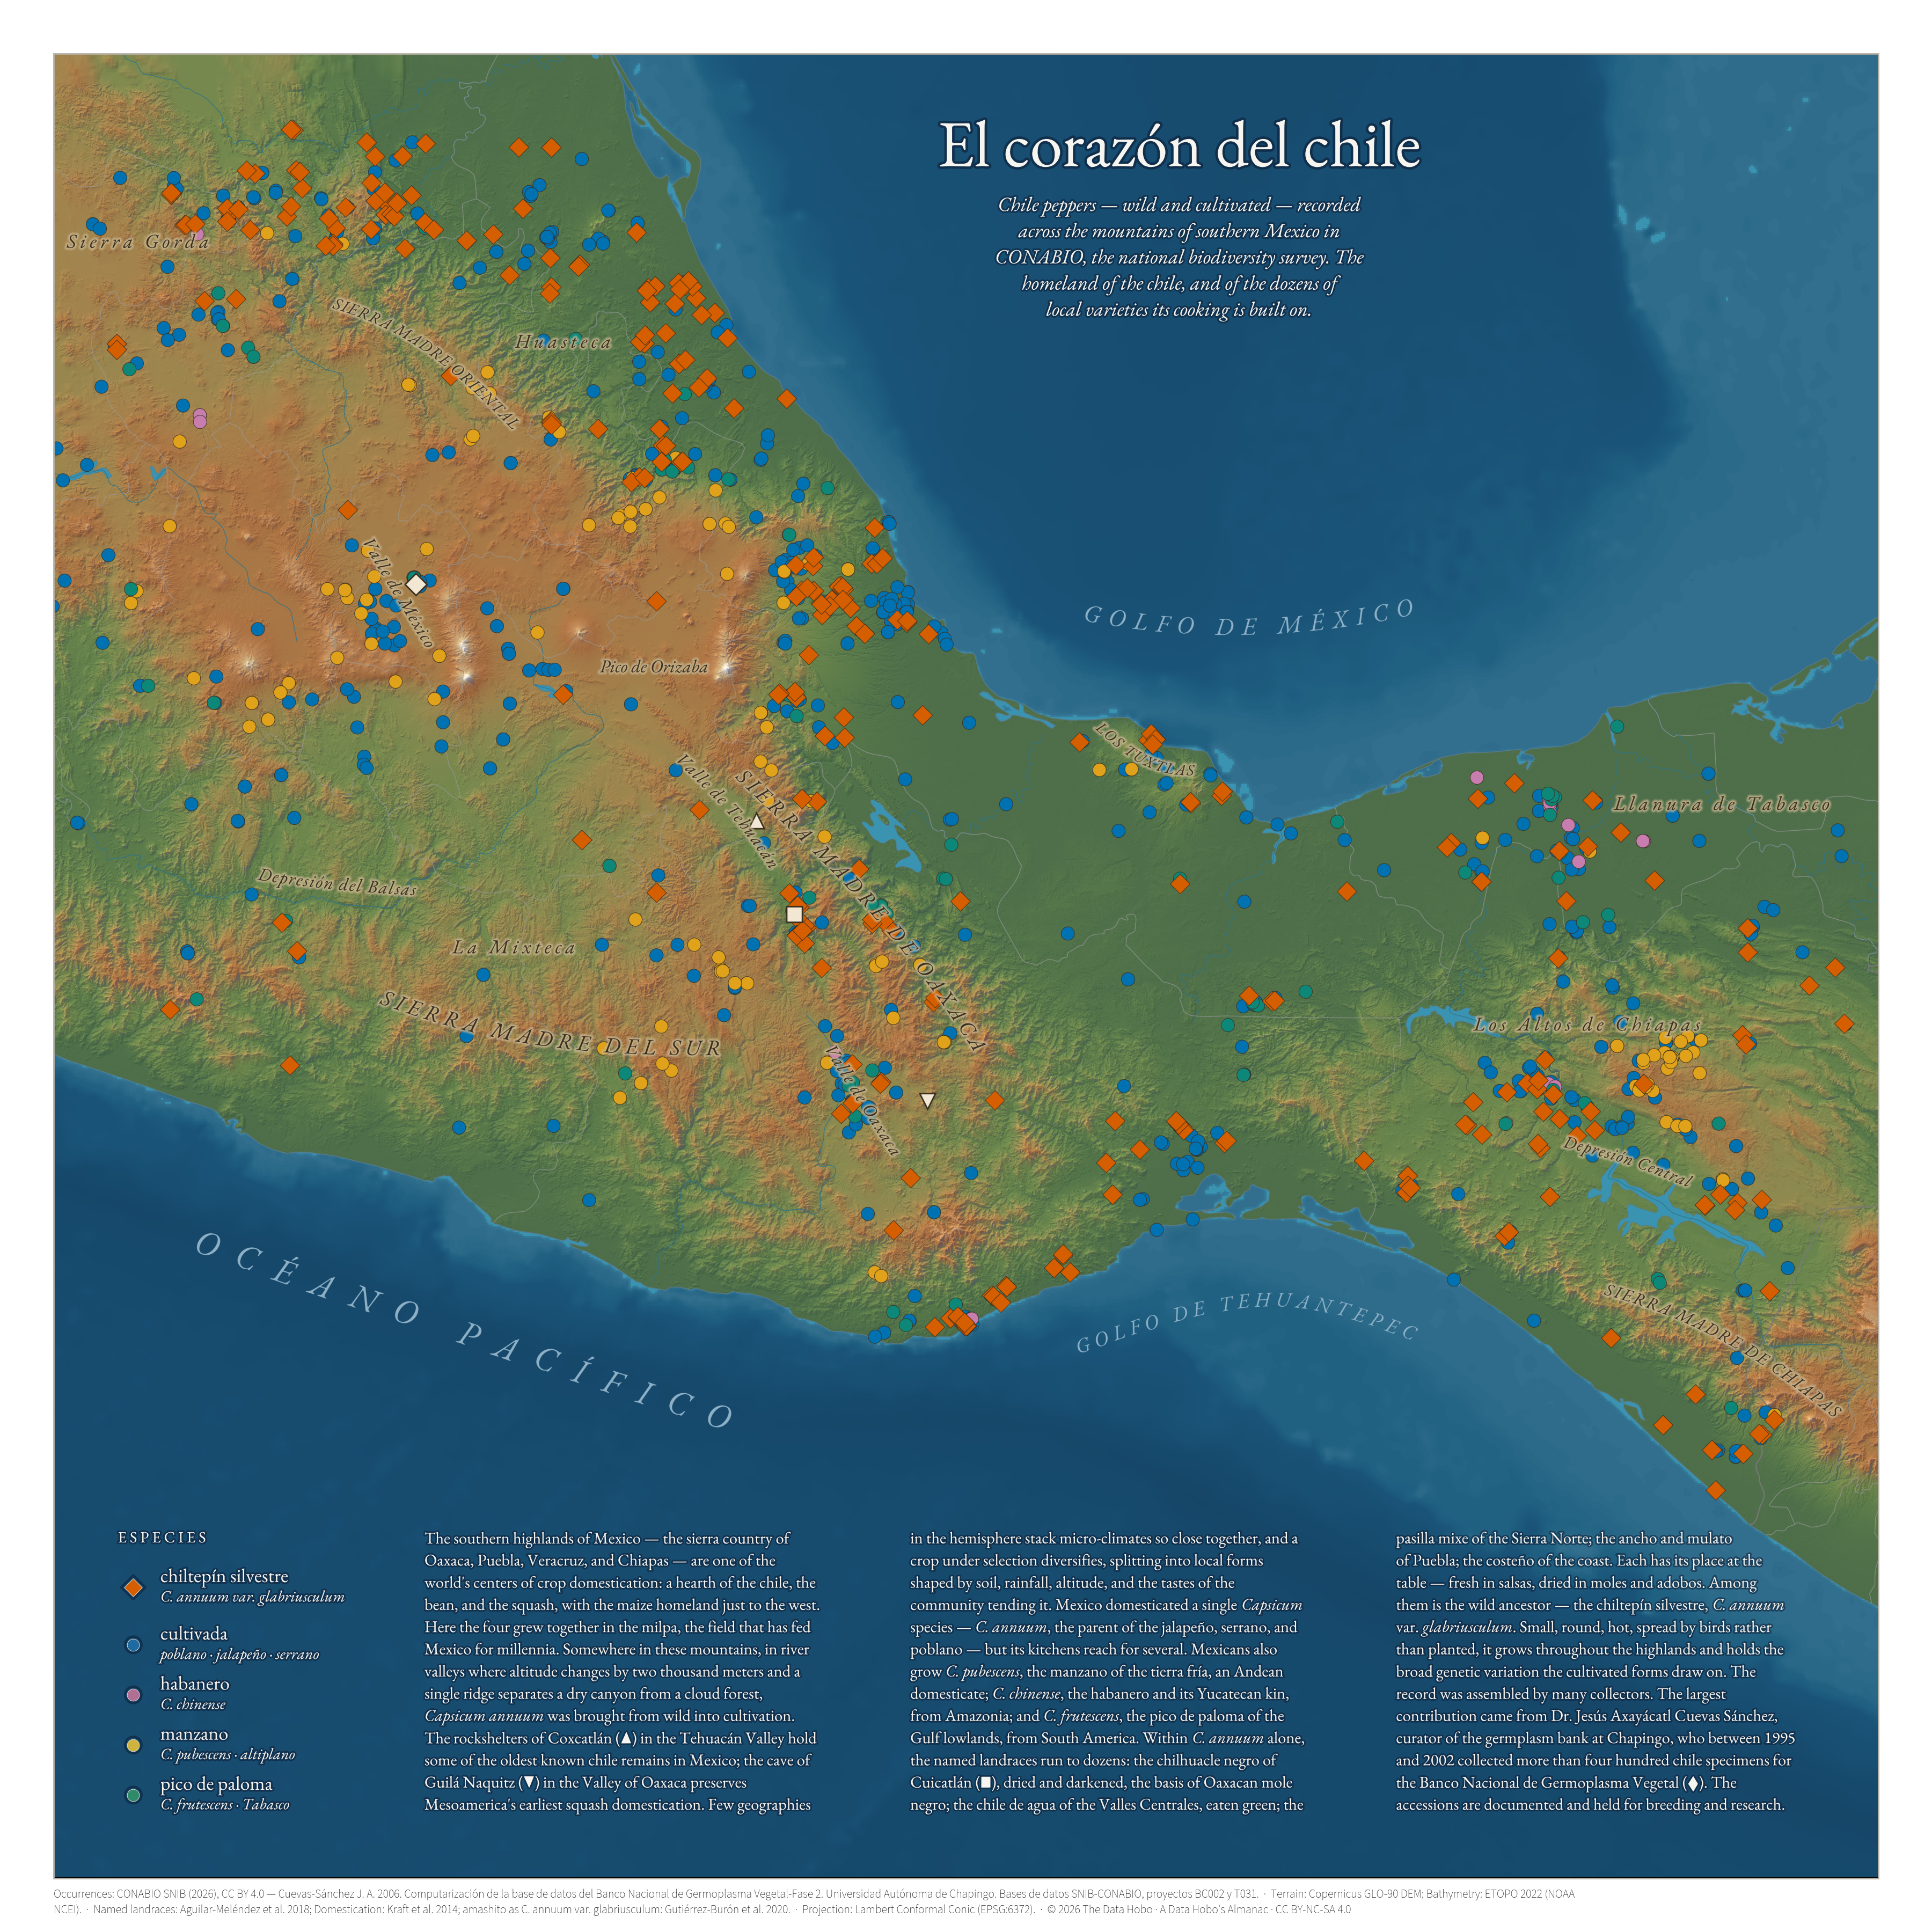
El corazón del chile
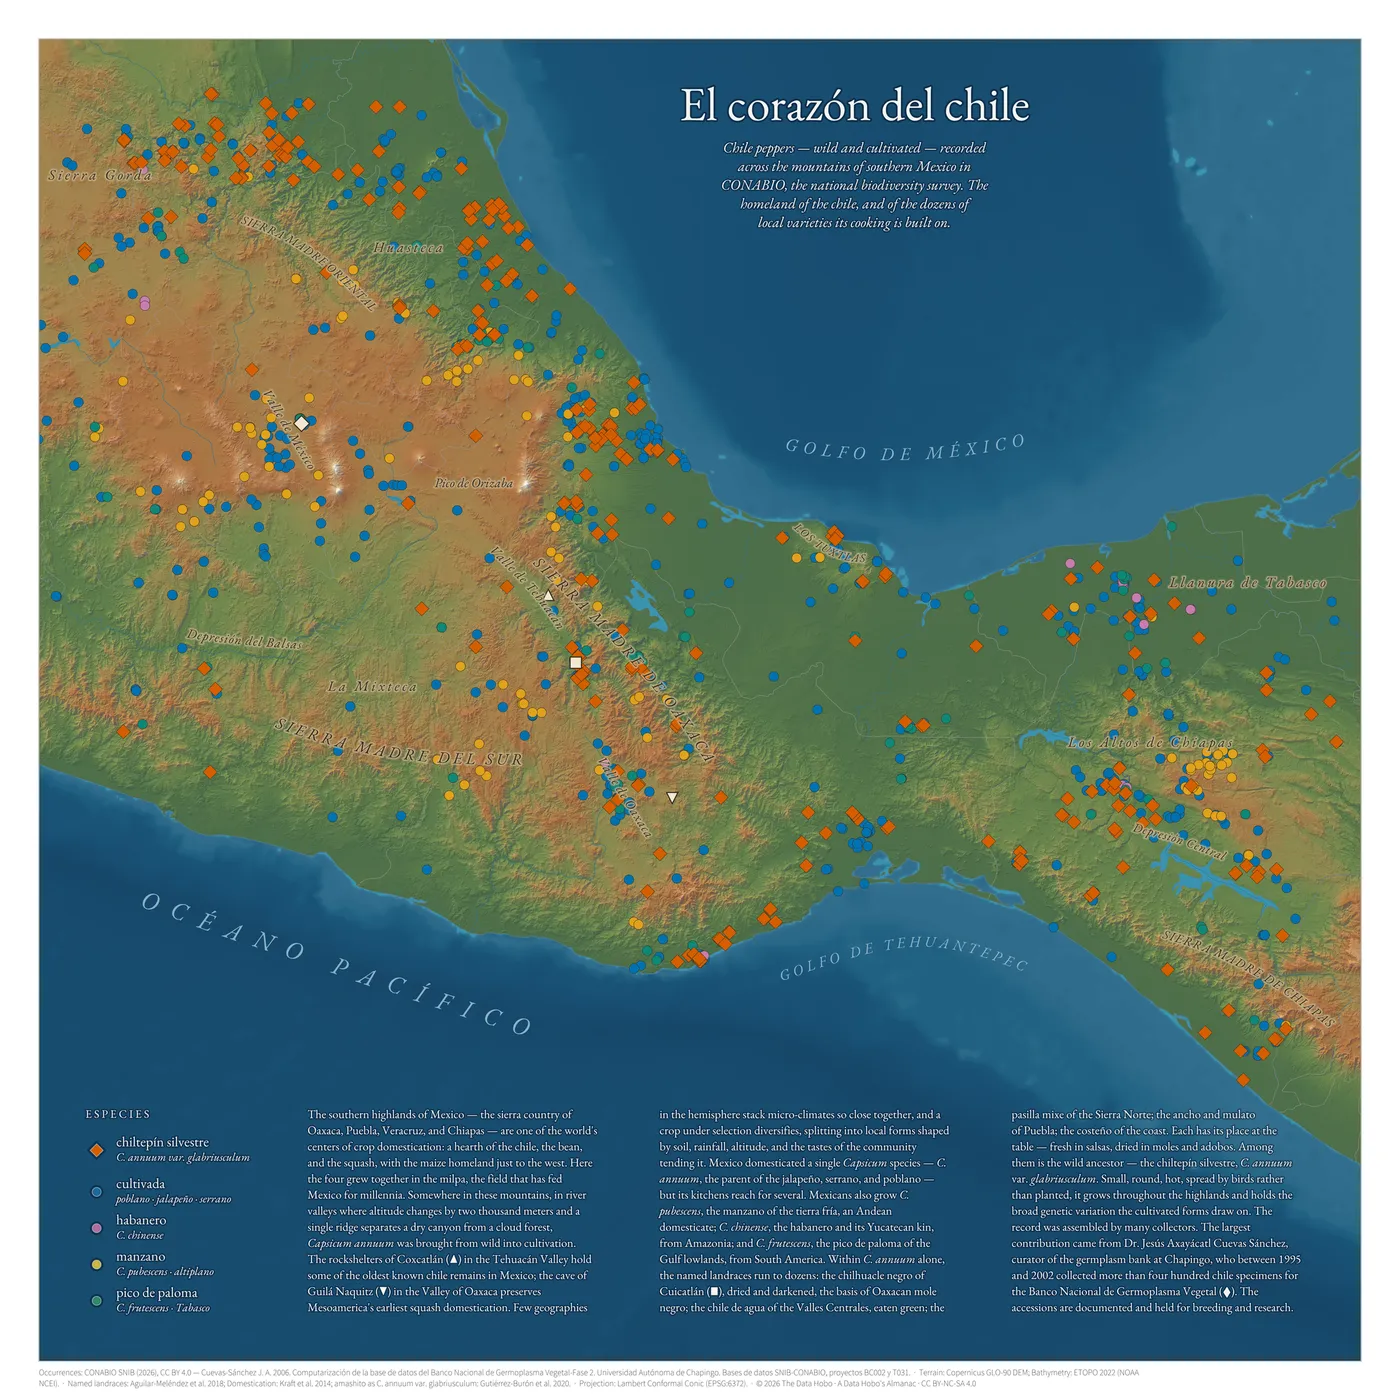
A map of the chile peppers — wild and cultivated — recorded across the mountains of southern Mexico, the sierra country where Oaxaca, Puebla, Veracruz, and Chiapas meet. This is one of the world’s hearths of crop domestication and the homeland of the chile: here Capsicum annuum, the species behind the jalapeño, serrano, poblano, and most of Mexico’s chiles, was brought from wild into cultivation. Within it alone the named landraces run to dozens — the chilhuacle negro of Cuicatlán that darkens Oaxacan mole negro, the chile de agua eaten fresh in the Valles Centrales, the pasilla mixe smoked over oak in the Sierra Norte. The wild ancestor, the bird-sown chiltepín, still grows throughout the highlands and holds the genetic variation the cultivated forms draw on.
Each point is an occurrence record from CONABIO’s Sistema Nacional de Información sobre Biodiversidad, laid over Copernicus GLO-90 terrain. The record was assembled by many field collectors over decades; the largest single contribution came from Dr. Jesús Axayácatl Cuevas Sánchez, who between 1995 and 2002 gathered more than four hundred chile specimens for the national germplasm bank at Chapingo. The domestication account follows Kraft et al. (2014), and the landrace nomenclature and geography follow Aguilar-Meléndez et al. (2018); the occurrence data is CONABIO SNIB, used under CC BY 4.0.
